Is History Repeating? The 2000 vs. 2026 Tech Comparison
- May 11
- 1 min read
The current AI boom is moving past the "echo" stage and into territory that mirrors the final weeks of the 2000 tech bubble. While the players are more profitable today, the technical data suggests we are reaching a fever pitch.
The Critical Numbers
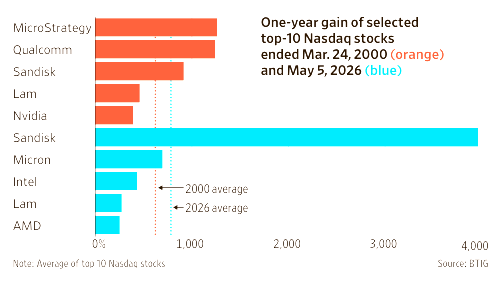
Velocity of Gains: In March 2000, the top 10 Nasdaq stocks averaged a 622% one-year gain. As of May 2026, that average has climbed to 784%.
Concentration Risk: AI-related stocks now hold a larger weighting in the S&P 500 than the "TMT" (Tech, Media, Telecom) sector did 26 years ago, making the broader index more vulnerable to a sector-specific pullback.
The "Profitability" Argument: Optimists point to the strong earnings of Nvidia and Microsoft compared to the hollow valuations of 2000. However, current cyclically adjusted P/E multiples for the S&P 500 remain at historically "lofty" levels.
Manias Peak on Good News: Historically, bubbles don't pop when things look bad; they "go out with a bang" while earnings still look great.
Valuation is Not Timing: High valuations confirm a bubble exists, but they are notoriously poor tools for predicting exactly when the party ends.
Familiar Faces: Ironically, many of today’s top performers—MicroStrategy, Qualcomm, and Lam Research—were the exact same names leading the charge in 2000.
-Chart from WSJ


Comments