Navigating the Bond Sell-Off, Oil Spikes, and Corporate Valuations

Global fixed-income markets showed signs of stabilization following an intense multi-day sell-off that pushed sovereign borrowing costs across major economies to multi-decade highs. A moderate pullback in crude oil prices helped alleviate immediate inflationary anxieties, but persistent macro pressures present significant structural headwinds for global corporate valuations.
Market Snapshot
Asset Class / Instrument | Recent Level / Yield | Context & Benchmark Comparison |
US 30-Year Treasury | 5.33% | Near multi-decade high (highest since 2007). |
US 10-Year Treasury | 4.94% | Reflects elevated discount rate baseline. |
German 10-Year Bund | 3.50% | Highest level since 2009 (Eurozone crisis level). |
UK 10-Year Gilt | 5.35% | Slight easing, remaining near 2007 highs. |
Brent Crude Oil | $104.76 / bbl | Retreated from overnight peak near $110/bbl. |
S&P 500 Index | 5,850.20 | Relief rally driven by short-term oil price decline. |
Macroeconomic Drivers
Monetary Policy: US August inflation printed in line with projections at 3.4% year-over-year. Futures markets have repriced the probability of a Fed interest rate hike next week to nearly 85%, up from 50% the prior week.
Geopolitics & Energy: Crude prices retreated to $104.76/bbl following news of impending discussions between Gulf ministers and Iran regarding access to the Strait of Hormuz. However, energy costs remain elevated, acting as a tax on global corporate margins.
Valuation Deep Dive: The Discount Rate Shock
Sovereign bond yields establish the risk-free benchmark rate in valuation frameworks. When 10-year Treasury yields anchor near 5.0% and 30-year yields exceed 5.3%, the Weighted Average Cost of Capital (WACC) increases across all corporate sectors.
A 100 to 150 basis point upward shift in the base risk-free rate increases WACC proportionately. Companies whose valuations depend primarily on distant terminal growth experience significant valuation compression as those future cash flows are heavily discounted.
Sector Vulnerabilities:
High-Multiple Growth & Tech: Face severe multiple contraction as investors demand higher immediate yields, reducing the equity risk premium.
Highly Leveraged Issuers: Must roll over maturing debt at significantly higher coupons, compressing net interest coverage ratios and lowering earnings per share.
Capital-Intensive Sectors: Face higher capital costs, leading to project delays or lowered return on invested capital.
Case Study: The NVIDIA (NVDA) Exception
While high-growth tech is generally vulnerable to WACC expansion, NVIDIA (NVDA) presents a structural exception due to unique cash generation dynamics.
Growth Offset: NVDA’s near-term earnings growth rate and high return on invested capital significantly outpace the incremental increase in WACC, allowing it to absorb the risk-free rate expansion in the near term.
Balance Sheet Insulation: With a massive net cash cushion and self-funded organic capital expenditure, NVDA bypasses expensive corporate bond markets entirely.
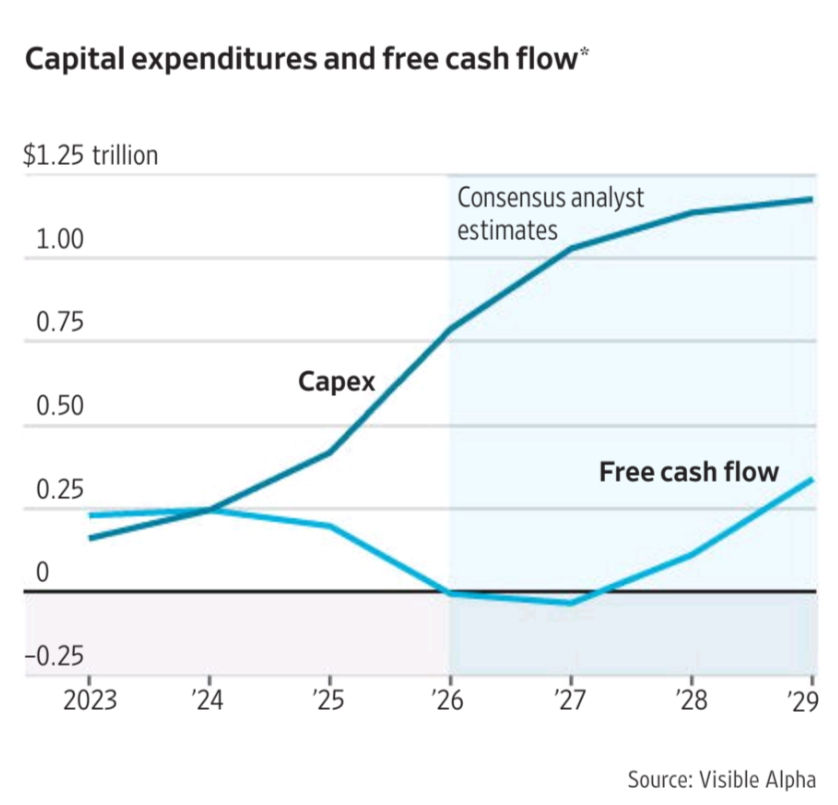
Customer CapEx Friction: The primary risk shifts to its hyperscaler customers (Microsoft, Alphabet, Meta), who face higher hurdle rates for capital deployment and must justify the return on multi-billion-dollar AI infrastructure buildouts amidst rising data center energy costs.
Strategic Portfolio Adjustments
Macro fundamentals dictate a defensive posture regarding multiple expansion:
Prioritize companies generating high free cash flow yields (FCF/Market Cap > 6-8%) over speculative revenue growth.
Emphasize firms with strong net cash positions or long-dated, fixed-rate debt profiles.
Recognize that sovereign yields above 5% offer highly competitive risk-adjusted returns, establishing a strict hurdle rate for equity risk.
When sovereign yields anchor near 5.0% and energy costs remain elevated, large-cap equities with high debt loads, long cash-flow durations, or interest-rate-sensitive customer demand experience the sharpest valuation markdowns and margin compression.
Company (Ticker) | Sector | Primary Vulnerability Vector | Valuation & Financial Impact |
Verizon Communications (VZ) | Telecommunications | High net debt & dividend yield competition | Rising refinancing costs; dividend yield penalized vs. 5%+ Treasuries |
NextEra Energy (NEE) | Utilities / Renewables | Debt-financed CapEx & high project hurdle rates | Reduced project NPV/ROIC; WACC squeezes fixed-rate contract margins |
Tesla (TSLA) | Consumer Discretionary | Auto loan rate sensitivity & high P/E multiple | Compressed gross margins from price cuts; elevated DCF discount rate |
American Tower (AMT) | Real Estate (REIT) | Leveraged capital structure & continuous CapEx | High borrowing costs depress Adjusted Funds From Operations (AFFO) growth |
Cloudflare (NET) | Enterprise Software | Long-duration cash flows & high valuation multiple | Severe multiple contraction as $r_f$ expansion discounts terminal value |
Verizon Communications (VZ)
Debt Refinancing Burden: Carries over $170B in net debt from 5G spectrum auctions and infrastructure rollouts. Rolling over maturing bonds into 6%–7% corporate coupons directly increases net interest expense and reduces Free Cash Flow to Equity (FCFE).
Fixed-Income Competition: As a traditional high-yield income stock, its equity risk premium collapses when risk-free 10-year and 30-year US Treasuries yield 4.9%–5.3%.
NextEra Energy (NEE)
Project Hurdle Rate Compression: Utility and clean energy expansion relies heavily on long-term project debt. A 150 bps shift in base rates raises the cost of capital above project IRR thresholds, delaying pipeline deployments.
Spread Squeeze: Existing long-term Power Purchase Agreements (PPAs) structured around lower baseline borrowing costs suffer margin compression as capital costs rise.
Tesla (TSLA)
Consumer Credit Friction: Over 80% of auto purchases involve financing. High interest rates increase monthly car payments, forcing price reductions to preserve volume and shrinking gross automotive margins.
Multiple Duration Risk: Because a large share of TSLA's market capitalization reflects future robotaxi and software options rather than current cash generation, higher $\text{WACC}$ heavily discounts its terminal value.
American Tower (AMT)
Leveraged Real Estate Model: REITs must distribute at least 90% of taxable income, making them dependent on debt markets to fund tower construction and data center expansions. Higher interest rates reduce earnings retention and slow AFFO per share growth.
Cloudflare (NET)
Un-Levered Duration Shock: While maintaining a clean balance sheet, NET trades at an exceptionally high sales multiple. In a high-yield environment, high-multiple tech stocks lacking large immediate net cash flow yields suffer mechanical valuation markdowns regardless of revenue growth.
Chart from FT


Comments